About the "UX MAP" Project
Context
This map uses bibliographic data to present an interactive, visual representation of UX research findings in an accessible and engaging manner. It is intended to give researchers, practitioners, and education technology developers the opportunity to explore, learn about, and find inspiration in the scientific literature.Studied corpus
Definition of the corpus.The visualizations are based on data extracted from Scopus. Specifically, we used bibliographic records (title, keywords, author, cited references, etc.) from 4 corpus of publications focusing on UX that were extracted from Scopus:
- the "UX Design" corpus was selected by using the query TITLE-ABS-KEY ( UX AND design* ) OR TITLE-ABS-KEY ( "user experience" AND design* ). The query, performed in April 2018, yielded publications records.
- the "Interaction Design" corpus was selected by using the query TITLE-ABS-KEY ( "information* architect*" ). The query, performed in April 2018, yielded 6215 publications records.
- the "Information Architecture design" corpus was selected by using the query TITLE-ABS-KEY ( "Interaction* Design*" ) . The query, performed in April 2018, yielded 1726 publications records.
- the "All combined" corpus, combining the above three corpus, contains 17414 publications records.
You may explore the metadata of the different corpus in the Corpus Description interface.
Thematic Map.
Topics detection.
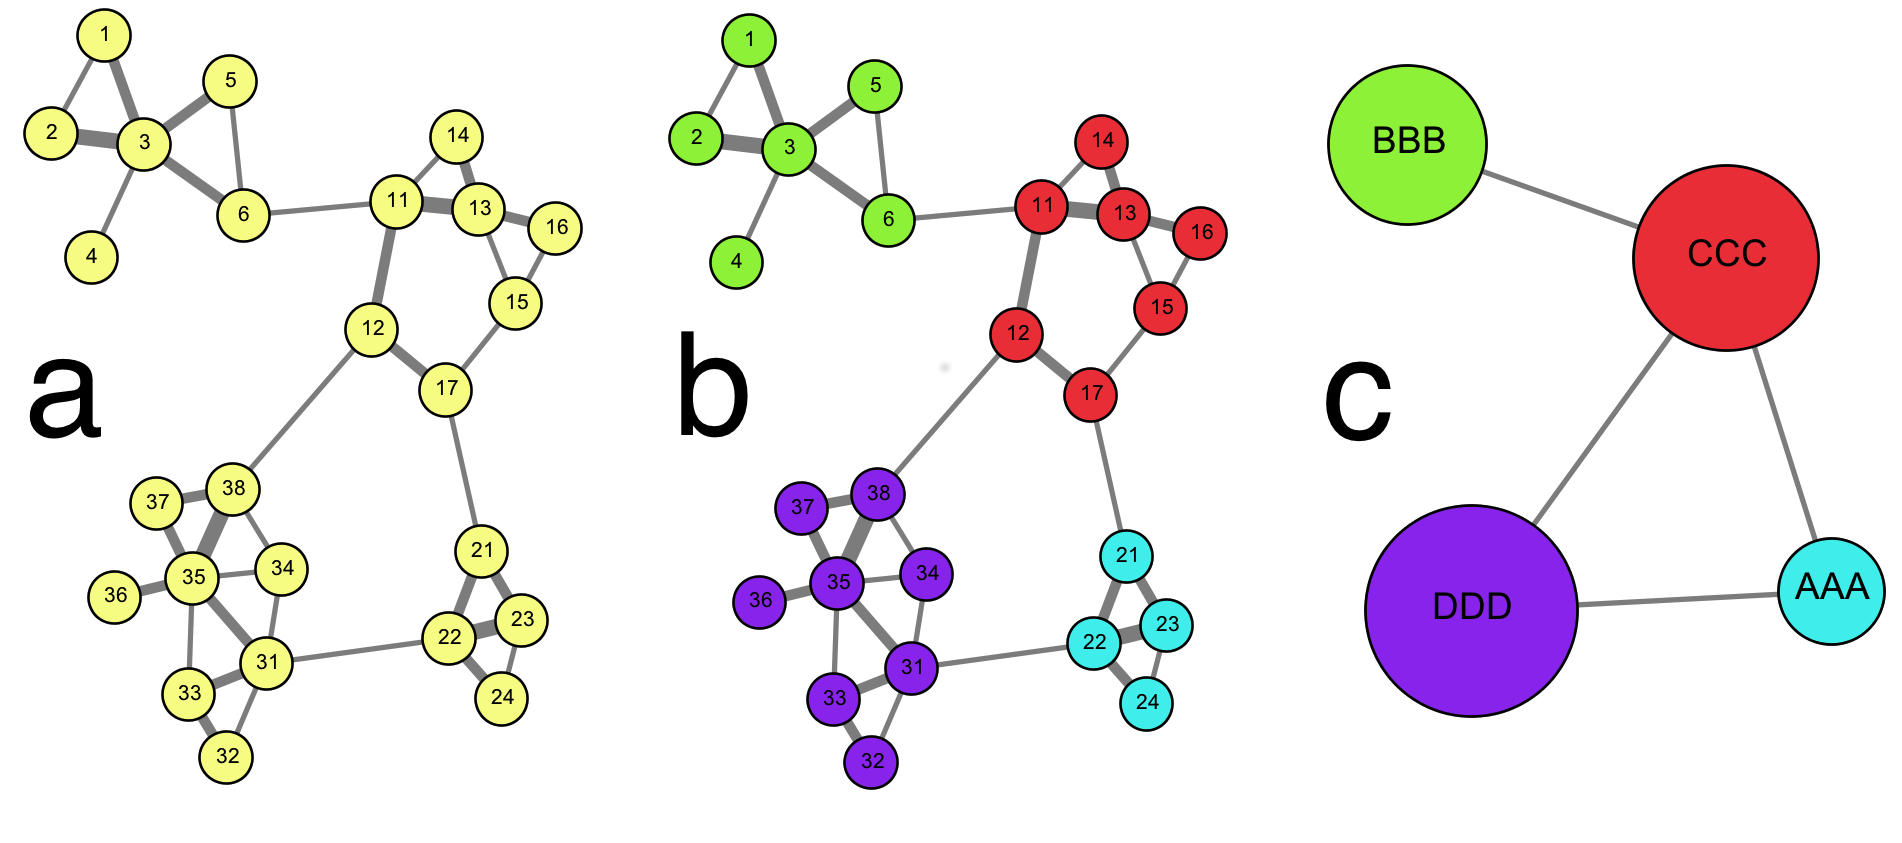
Starting from the extracted data, we first created a bibliographic coupling network, linking articles sharing at least one common reference (Fig. a). We then applied a community detection algorithm to define our "topics" as groups of articles corresponding to dense - in terms of links per article - regions of the network (Fig. b). In the final map, articles belonging to the same group are gathered into a single node, or circle, whose size is proportional to the number of article it contains (Fig. c). The most frequent keywords / references / subject / journals sources among the publications of each topic are also detected to serve as labels.
We apply the exact same methodology to the subsets of publications belonging to each detected topic to split them into subtopics.
Resulting maps.
12012 publications of the combined corpus are in the bibliographic coupling network, i.e. sharing at least one reference with at least another publication. Each of the remaining publication is isolated, i.e. does not share more than one reference with any other publications in the corpus. The Thematic Map shows their partitioning into 19 topics with more than 50 publications (around 11350 publications in total) and 197 subtopics with more than 10 publications (around 10650 publications in total).
Exploring the maps.
Here are some ways you can interact with the map:
- Select either "Topics" or "Subtopics" to explore broad or more focused areas of research.
- Select either "Static" or "Dynamic" to switch between the static and dynamic versions of the map.
- Hover over a circle to see its topic label and highlight its links to other topics.
- Click on a circle (topic or subtopic) to open an information pane that provides more information on that topic, such as the most commonly used keywords, references or publication journal in that topic, the institutions and countries that publish within that topic, or the most cited / representative publications within that topic.
- Double-click on a Topic circle to explore subtopics within that broad area of study.
- Use your browser controls to zoom and pan over the map.
- In the "Legend" tab:
- You can choose the nature of the displayed labels to either the most frequent keyword, title word, reference etc. among the publications of each topic.
- In the "Search" tab, you can look for a particular research topic or researcher:
- Use the search box to perform a search among the most frequent items and most cited papers/authors of the topics. Topics where the searched item appears will be highlighted.
- In the "Layout" tab:
- Use the sliders to filter a research topics based on their number of publications and links based on the similarity of two topics.
- Tune the parameters of the algorithm running the dynamic layout
- In the "Export" tab, you will be able to export a PNG version of the map
- Tune the spatial layout using symetries or rotations.
- Tune the format of the labels to enhance theur visibility.
Credits
Data processing, analysis and visualisation: Sebastian Grauwin.Web design: Sebastian Grauwin & Isabelle Sperano.
The visualizations are build on BiblioTools and D3. Please note that they may not work on all browsers.